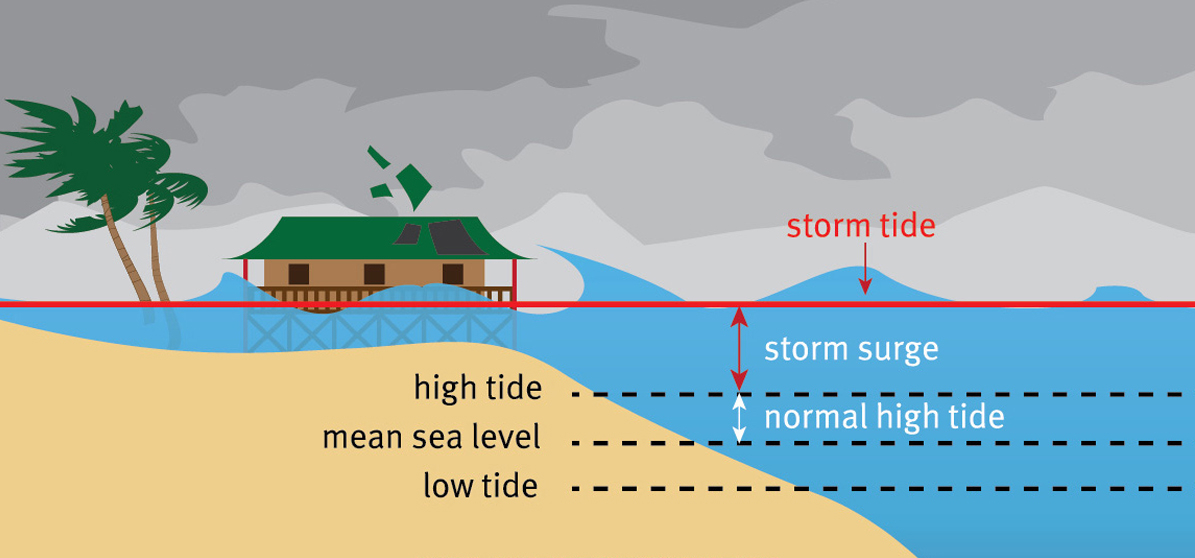
A storm tide is a high water level caused by the combination of the normal astronomical tide and a hurricane storm surge. The storm surge is ocean water pushed onto land by strong wind and is among the hurricane's most destructive and deadly hazards; it's influenced by the hurricane's intensity, size, forward speed and direction, as well as the coastal topography and bathymetry. The storm tide will be higher if the peak storm surge arrives at high tide compared to low tide. At the Rosenstiel School campus, that diurnal tidal range between high and low tides is about 2.2 feet (67 cm).
Historic Storm Tides
Since the Rosenstiel School campus was established on Virginia Key in 1951, several hurricanes passed close enough to produce notable and even destructive storm tides. As of 2023, the highest storm tide was generated by Hurricane Andrew in 1992, and only three events have overtopped the seawall. This table provides a history of over one dozen storm tides, when they occurred, and how the data on the high water marks were acquired or estimated.
Although sea level rise occurs at a much slower and much less dramatic timescale than a storm surge, over the span of decades it does make a noticeable contribution to the storm tide. In recent decades, the average rate of sea level rise at this location is approximately 0.25 inches per year (0.64 cm/yr), and while that may not sound like much, it adds up to about one foot in half a century. For the older storms in the list, that makes a significant difference. As a practical example, Hurricane Andrew's storm tide would be roughly 0.6 feet (7 inches or 18 cm) higher in 2022 than it was in 1992.
Accordingly, the highest tides of the year ("King Tides") are getting higher, and since 2015, several high tides have surpassed historic storm tides. The highest in recent years occurred on October 5, 2017 and reached 2.31' NAVD88, which is roughly the same as the storm tide caused by Hurricane Cleo, a Category 2 hurricane that made landfall just a few miles north of Miami in 1964.
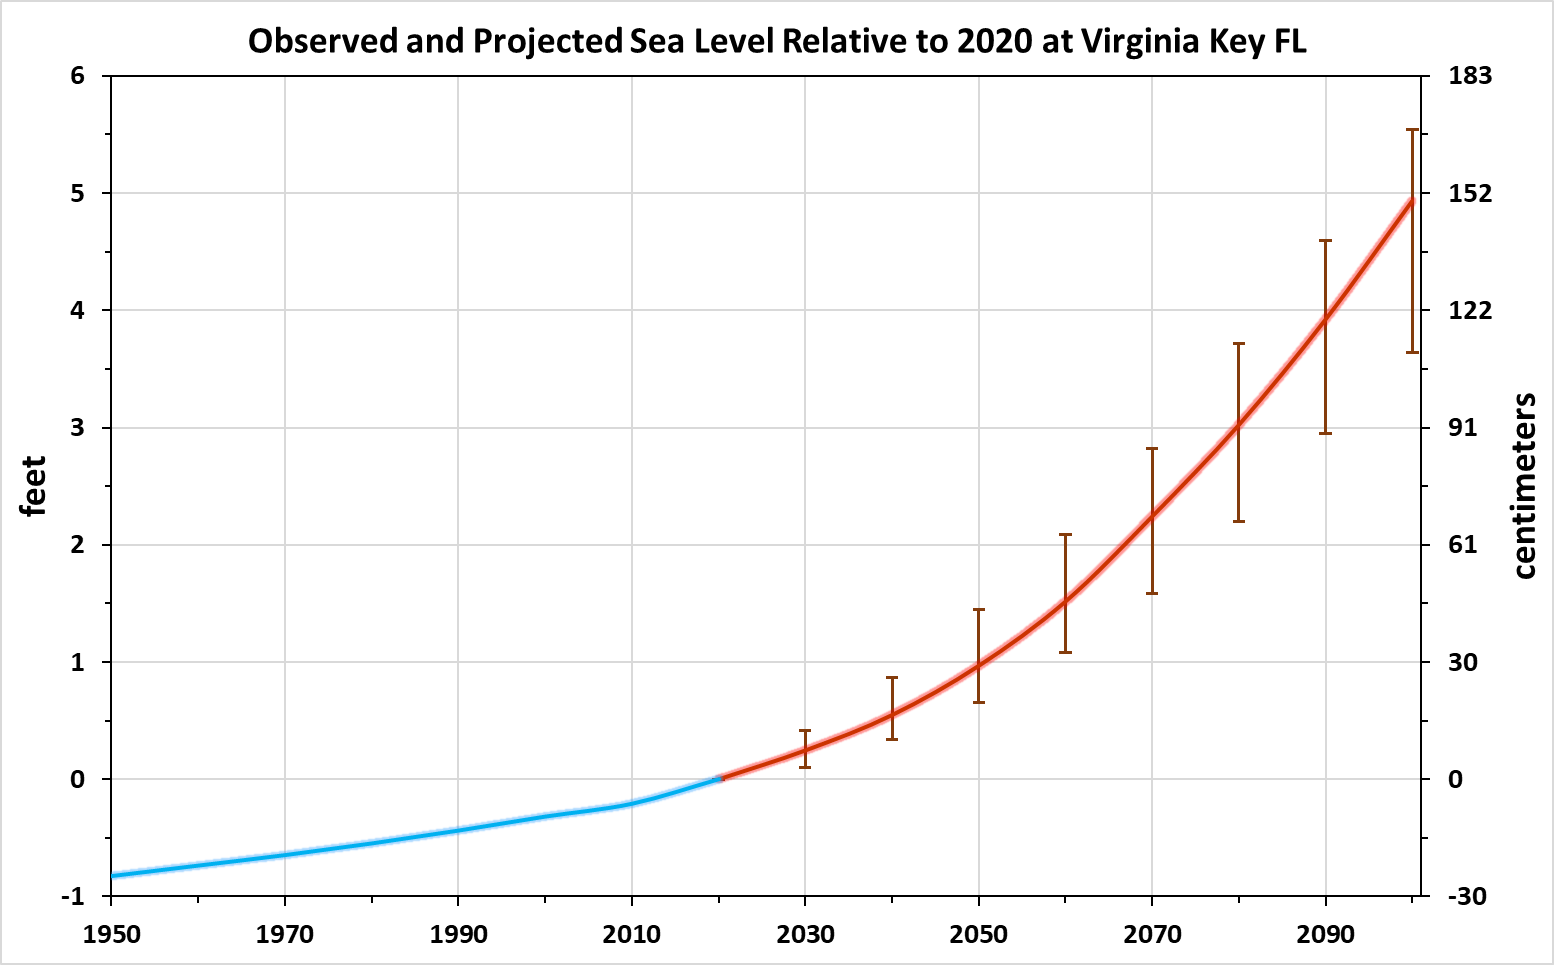
The rate of sea level rise is increasing. Using the latest "Intermediate-High" projection for Virginia Key, sea level could increase by 1.0 foot by 2050 and 2.2 feet by 2070, relative to 2020 levels. By 2060, King Tides will likely reach Hurricane Irma's storm tide at this location, and by 2085, the highest tides could reach Hurricane Andrew's storm tide. A higher sea level increases the baseline upon which storm surge occurs, making flooding more likely, severe, and widespread.
Sea level at Virginia Key, expressed in feet relative to 2020. Historical values (blue) come from previous tidal epochs and tide gauge measurements; future values (red) come from the NOAA Intermediate-High projection (with associated error bars).
Vertical Datums
A vertical datum is simply a reference elevation from which other elevations can be measured. There are two types of vertical datums: geodetic and tidal. An example of a geodetic datum is the North American Vertical Datum of 1988 (NAVD88) and an example of a tidal datum is mean sea level (MSL). Elevations anywhere in North America can be referenced to NAVD88, while the use of tidal datums is generally limited to coastal areas.
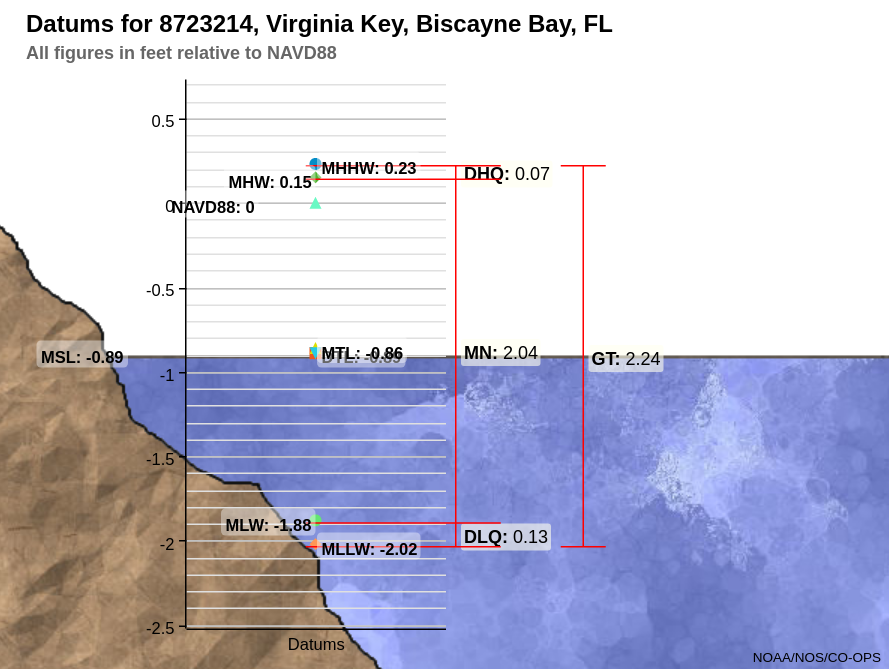
Tidal datums evolve and are updated approximately every 20 years. Reference levels such as the Mean Lower Low Water (MLLW), Mean Sea Level (MSL), and the Mean Higher High Water (MHHW) are determined at each tide gauge, and vary from station to station. Any of those levels can in turn be referenced to NAVD88. The three most recent tidal datum epochs that are relevant to the storm tides listed here are 1941-1959, 1960-1978, and 1983-2001. A new set of tidal datums spanning 2002-2020 will be released in 2025.
An example of the most recent relationships from Virginia Key is shown in the figure below, all shown relative to NAVD88. There are many tidal datums, but the most commonly-used are MLLW, MSL, and MHHW.
This table provides conversion values for the geodetic and tidal datums relevant to this work (all are expressed relative to NAVD88 at Virginia Key). The location-specific geodetic datum conversion from NAVD88 to NVGD29 is available from the NOAA National Geodetic Survey, recent tidal datum conversions for this site are available from the NOAA National Ocean Service, and the conversion from the oldest tidal datum (1941-1959) to NGVD29 is available from Tides and Tidal Datums (p. 45) and is from nearby Miami Beach.
Difference from NAVD88
Vertical Datum
+ 0.23'
1983 - 2001 MHHW
+ 0.04'
1960 - 1978 MHHW
0.00
NAVD88
- 0.03'
1941 - 1959 MHHW
- 0.89'
1983 - 2001 MSL
- 1.10'
1960 - 1978 MSL
- 1.28'
1941 - 1959 MSL
- 1.57'
NGVD29
- 2.02'
1983 - 2001 MLLW
- 2.26'
1960 - 1978 MLLW
- 2.53'
1941 - 1959 MLLW
Please contact Brian McNoldy (bmcnoldy[at]miami.edu) with questions or comments about the data or the outdoor installation on the Rosenstiel School's Marine Science Center building.